1
Relations
| EN | DE |
Relation: From Old French relacion, from Latin relatio, from verb refero ("I refer, I relate"), from prefix re- ("again") + fero ("I bear, I carry");
The manner in which two things may be associated; the act of relating a story. A statement of equality of two products of generators, used in the presentation of a group.
(Source: Wiktionary)
| Modes of Being | Cyberspace has been described as a mode of being. The experience of 'being' in cyberspace, as opposed to viewing the same on a screen, requires a certain interactivity and virtual objects to simulate one's presence. Iconic representation ensures that my digital avatar will shake its head when I disagreed by typing the word 'No'. Avatars can be used to communicate in a group, but this requires the co-presence of participants in the one electronic space. 'Technological-human fusions' like AI-Chatbots can be invoked from multiple computers and at any time. In human-agent teaming, software agents collaborate with each other, as well as human operators. |
|---|---|
| ➔ State of the Practice | |
| Personas |
Designers need to understand the user in order to create suitable products (goods and services). Personas serve to embody
significant characteristics of a user group. Though fictitious itself, a persona is based on real people, allowing designers to
address real expectations, motivations and goals. Since personas represent, or even simulate, user behaviour they can be used to
conceive and validate user experiences. The creation of a persona involves:
|
| ➔ Interaction Design | |
| Data Charts |
Data charts convert qualitative and quantitative data into visual objects so as to convey relationships or causalities
at a glance.
"Information graphics [...] communicate knowledge visually rather than verbally; they let people use their eyes and minds to draw their own conclusions; they show rather than tell" (Tidwell, 2006). |
| Data Gathering & Analysis |
1) UI/UX Designers constantly re-evaluate the way people might use computer-mediated spaces to interact with information,
machines and other users. This generates data (especially in a "research-through-design" context) as well as artefacts, knowledge
and new practices. Qualitative data may be gathered by means of prototype testing, interviews and questionnaires.
Prototype testing helps verify the feasibility of the concept or utility/usability of the product and incorporates suggestions for improvement. Users may "walk through" key functionalities of the design by means of a basic paper prototype. High-fidelity prototyping involves more advanced interactive [digital] versions. Participants normally accomplish specific tasks by interacting with the prototype and respond to questions in a structured interview. 2) Primary data can be collated into analysable data sets using spreadsheets. Qualitative data should be examined in several ways, for example to:
Grounded-Theory methods are very useful for structuring and analysing qualitative data. This allows the practitioner to establish categories, properties, relations and dimensions, as well as a conditional matrix. A deeper analysis may incorporate so-called "theoretical codes" [process, means-goals, cultural] and consider interaction, causality and temporal change. |
| Project: The Butterfly Effect |
|
| Case Study: The Foucault Pendulum |
In 1851 Léon Foucault suspended a pendulum from the dome of the Panthéon [in Paris] in order to demonstrate that the Earth rotates.
The experiment involved a 28kg metal sphere attached to a long wire, a stylus that could trace the path of the pendulum on wet sand,
and a 6m-diameter graduated horizontal ring. Even though the swing plane itself remained unaltered, while the building and the Earth
beneath it turned, the pendulum appeared to slowly advance in a clockwise direction.
At the poles where the pivot would merge with the Earth's axis of rotation, a Foucault Pendulum sweeps out a full circle in one siderial day - clockwise in the northern hemisphere and anticlockwise in the southern hemisphere. Other geographic locations are subject to a deviation of the [polar] vertical caused by a centrifugal force, leading to a latitude-specific slowdown. The pendulum takes just over 32 hours to complete a circuit at the latitude of Munich and some 43 hours at the latitude of Sydney. At the equator, it will require an infinite amount of time to complete the circuit. The swing plane seems to ignore the motions of the earth and the solar system, maintaining its orientation toward the distant stars ... One problematic consideration with respect to the Foucault Pendulum is to determine a meaningful reference frame based on Newtonian principles - that is, absolute space, uniform motion, and acceleration. |
| Case Study: Place de la Concorde |
In the mid 18th century king Louis XV decided to place an equestrian statue at the intersection of the rue royale and the Louvre-Etoile
axis. To encircle this statue his architect Jacques-Ange Gabriel conceived a grand octagonal design in the manner of a French garden.
The Place Louis XV was thus inaugurated in 1763. The statue, however, was torn down by the people in 1792 and replaced by the
guillotine. A second stage of development, based upon the plans of Gabriel, began during the 1830's - although the current name of
Place de la Concorde had first come into effect in 1795.
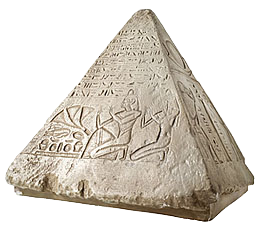
The Obelisque de Luxor was installed on a new pedestal in the centre, an arrangement completed on either side by elaborate bronze fountains which are dedicated to the rivers and the sea. Each corner of the place represents a French city, with eight marble statues respectively symbolizing Lyon and Marseilles (by the sculptor Petitot), Bordeaux and Nantes (by Caillonettes), Rouen and Brest (by Jean-Pierre Cortot), Lille and Strassburg (by Jean Jacques Pradier). The western entrance of the Place de la Concorde is flanked by the horses of Marly, carved for another royal château by Guillaume Coustou before their move to Paris in 1795. The obelisk received a golden pyramidion in 1998. |

|
|
| ➔ The Louvre |
